


Pupil Premium Review of Spending 2019-20
In 2019-20, there were 276 students at Oxted School in receipt of the Pupil Premium funding. Therefore, the pupil premium allocation for the academic year 2019-20 is £258,060.
Diminishing the Difference
Year 11 Headline Data
Centre Assessed Grades and subsequent Exam Board Awarded Grades were scrutinised carefully by teachers, Faculty Heads, SLT, and the Head before being submitted. The process was clearly outlined, was fair, and predicted our best guess for the grade our students would have achieved had the exams happened as planned. This said, the grades reported herein reflect a wholly different data environment than in previous years, one not reliant on exam performance, but instead on teacher and faculty leads’ knowledge of their students and their exam specifications.
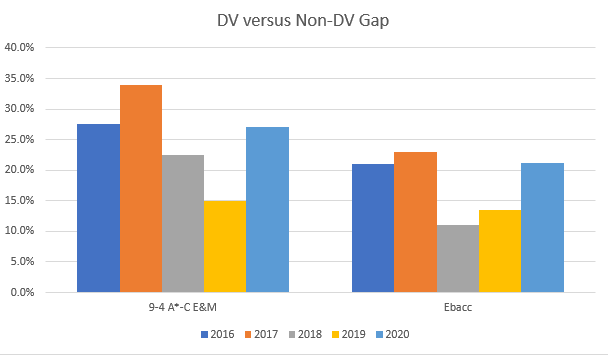
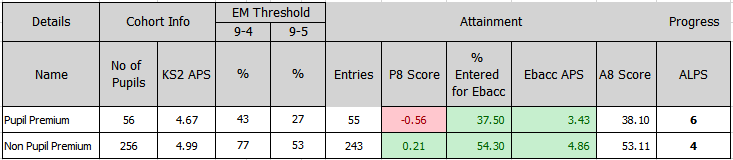
The gap between DV and non-DV students has risen again in both 9-4 E&M and EBACC measures, which may be expected given that the KS2 APS gap was significantly lower for our DV students at 4.67 versus 4.99 for our non-DV students. The overall P8 gap remains: DV students were awarded an ALPS score of 6, compared to the 4 for non-DV students.
DV outcomes remained disparate compared to non-DV student outcomes at every data capture through the year. DV EBACC APS (3.4) was higher than in previous years (in 2019, this measure was 3.11), but still significantly lower (26%) than the whole school cohort APS of 4.6.
The percent of DV students entered for EBacc decreased in 2020 from 44% to 37.5%. On the surface, this could demonstrate a narrowed curriculum for this group of students, but since there was a non-DV drop in this measure by 4%, it likely illustrates a more rigorous tailoring, creating bespoke curriculum plans for all. This said, progress measures in the Open Basket were low for DV students (-0.76), indicating that even in their chosen subjects, progress was limited.
The P8 score increased dramatically from -0.65 in 2019 to -0.56 in 2020. Though still significantly negative and far from the whole school P8 score of 0.07, we are pleased with this substantive gain. Our overall ALPS score of a 6 was positive compared to 2019’s ALPS 8.
Though the DV A8 score of 38.10 was significantly lower than the non-DV A8 score of 53.11, this is an improvement from 2019’s 35.82.
Behaviour
Behaviour for learning has improved at Oxted School, and students are working with staff to have restorative conversations and reflect on their behaviour.
We are pleased with the fact that no permanent exclusions were DV students. In addition, the percentage of FTEs that were DV students fell last year from 45% of all FTEs to 29%. This is still too high a percentage, as it exceeds the proportion of DV in the cohort. The number of FTEs for both all students and DV students decreased from autumn to spring likely due to the students settling into the new behaviour system. This said, the proportion of FTEs applied to DV students was higher than in the previous term. 100% of all FTEs in summer were DV students, these figures do not reflect normal in-school activity, as school was closed due to lockdown during this period.
|
Behaviour Category |
Autumn |
Spring |
Summer |
|
FTE exclusions (all students) |
79 |
32 |
2 |
|
FTE exclusions (DV only) |
23 (29%) |
12 (37.5%) |
2 (100%) |
|
Permanent Exclusions (all students) |
1 |
0 |
0 |
|
Permanent Exclusions (DV only) |
0 |
0 |
0 |
Year 8 Scholars Programme
24 x students were chosen to take part in being mentored by a PHD student and attending university. Unfortunately, the programme at Reading University was postponed then later cancelled due to COVID restrictions.
In 2020/21, the programme will run for 24 x Year 8 and Year 9 students whose prior attainment allows them to access the robust programme and whose attendance
We have also used the programme as an incentive for harder-to-reach students.
Key Data
|
Basic |
2016 |
2017 |
2018 |
2019 |
2020 |
|
School DV |
37% |
36% |
48% |
53% |
27% |
|
School All |
65% |
70% |
71% |
68% |
48% |
|
Attainment 8 |
2016 |
2017 |
2018 |
2019 |
2020 |
|
School DV |
38.5 |
34.22 |
36.1 |
37.72 |
38.10 |
|
School All |
51.7 |
46.88 |
49.4 |
47.48 |
50.40 |
|
P8 |
2016 |
2017 |
2018 |
2019 |
2020 |
|
School DV |
-0.73 |
-0.98 |
-0.69 |
-0.6 |
-0.56 |
|
School All |
+0.06 |
-0.22 |
-0.21 |
-0.3 |
0.07 |
|
EBACC |
2016 |
2017 |
2018 |
2019 |
2020 |
|
School DV |
20% |
15.38% |
14% |
10% |
14.29% |
|
School All |
41% |
38.35% |
25% |
23% |
28.03% |